New to Akka? Start with the Akka SDK.
Phi Accrual Failure Detector
Introduction
Remote DeathWatch uses heartbeat messages and the failure detector to detect network failures and JVM crashes.
The heartbeat arrival times are interpreted by an implementation of The Phi Accrual Failure Detector by Hayashibara et al.
Failure Detector Heartbeats
Heartbeats are sent every second by default, which is configurable. They are performed in a request/reply handshake, and the replies are input to the failure detector.
The suspicion level of failure is represented by a value called phi. The basic idea of the phi failure detector is to express the value of phi on a scale that is dynamically adjusted to reflect current network conditions.
The value of phi is calculated as:
phi = -log10(1 - F(timeSinceLastHeartbeat))
where F is the cumulative distribution function of a normal distribution with mean and standard deviation estimated from historical heartbeat inter-arrival times.
An accrual failure detector decouples monitoring and interpretation. That makes them applicable to a wider area of scenarios and more adequate to build generic failure detection services. The idea is that it is keeping a history of failure statistics, calculated from heartbeats received from other nodes, and is trying to do educated guesses by taking multiple factors, and how they accumulate over time, into account in order to come up with a better guess if a specific node is up or down. Rather than only answering “yes” or “no” to the question “is the node down?” it returns a phi value representing the likelihood that the node is down.
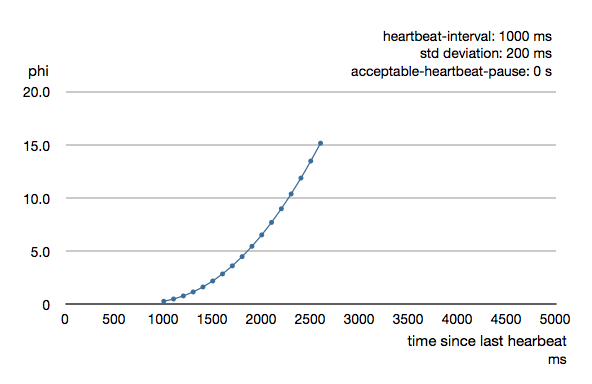
The following chart illustrates how phi increase with increasing time since the previous heartbeat.

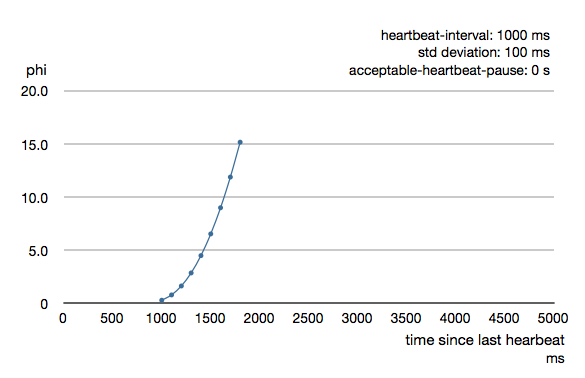
Phi is calculated from the mean and standard deviation of historical inter arrival times. The previous chart is an example for standard deviation of 200 ms. If the heartbeats arrive with less deviation the curve becomes steeper, i.e. it is possible to determine failure more quickly. The curve looks like this for a standard deviation of 100 ms.

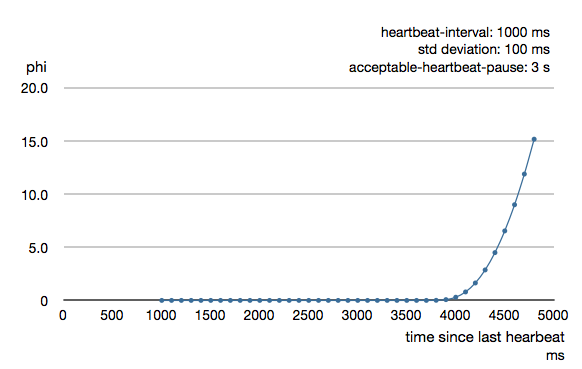
To be able to survive sudden abnormalities, such as garbage collection pauses and transient network failures the failure detector is configured with a margin, which you may want to adjust depending on you environment. This is how the curve looks like for failure-detector.acceptable-heartbeat-pause configured to 3 seconds.

Logging
When the Cluster failure detector observes another node as unreachable it will log:
Marking node(s) as UNREACHABLE
and if it becomes reachable again:
Marking node(s) as REACHABLE
There is also a warning when the heartbeat arrival interval exceeds 2/3 of the acceptable-heartbeat-pause
heartbeat interval is growing too large
If you see false positives, as indicated by frequent UNREACHABLE followed by REACHABLE logging, you can increase the acceptable-heartbeat-pause if you suspect that your environment is more unstable than what is tolerated by the default value. However, it can be good to investigate the reason so that it is not caused by long (unexpected) garbage collection pauses, overloading the system, too restrictive CPU quotas settings, and similar.
akka.cluster.failure-detector.acceptable-heartbeat-pause = 7s
Another log message to watch out for that typically requires investigation of the root cause:
Scheduled sending of heartbeat was delayed
Failure Detector Threshold
The threshold that is the basis for the calculation is configurable by the user, but typically it’s enough to configure the acceptable-heartbeat-pause as described above.
- A low
thresholdis prone to generate many false positives but ensures a quick detection in the event of a real crash. - Conversely, a high
thresholdgenerates fewer mistakes but needs more time to detect actual crashes. - The default
thresholdis 8 and is appropriate for most situations. However in cloud environments, such as Amazon EC2, the value could be increased to 12 in order to account for network issues that sometimes occur on such platforms.
